April 30, 2020 @ 19:55
Visualising an authentication server as a graph
The team that I work in at MYOB has the difficult task of migrating applications from an internal authentication server to an external provider.
To figure out where to start, our team analysed our auth server's logs.
As a side project, I made this data visualisation based on those logs, which you can find on Github.
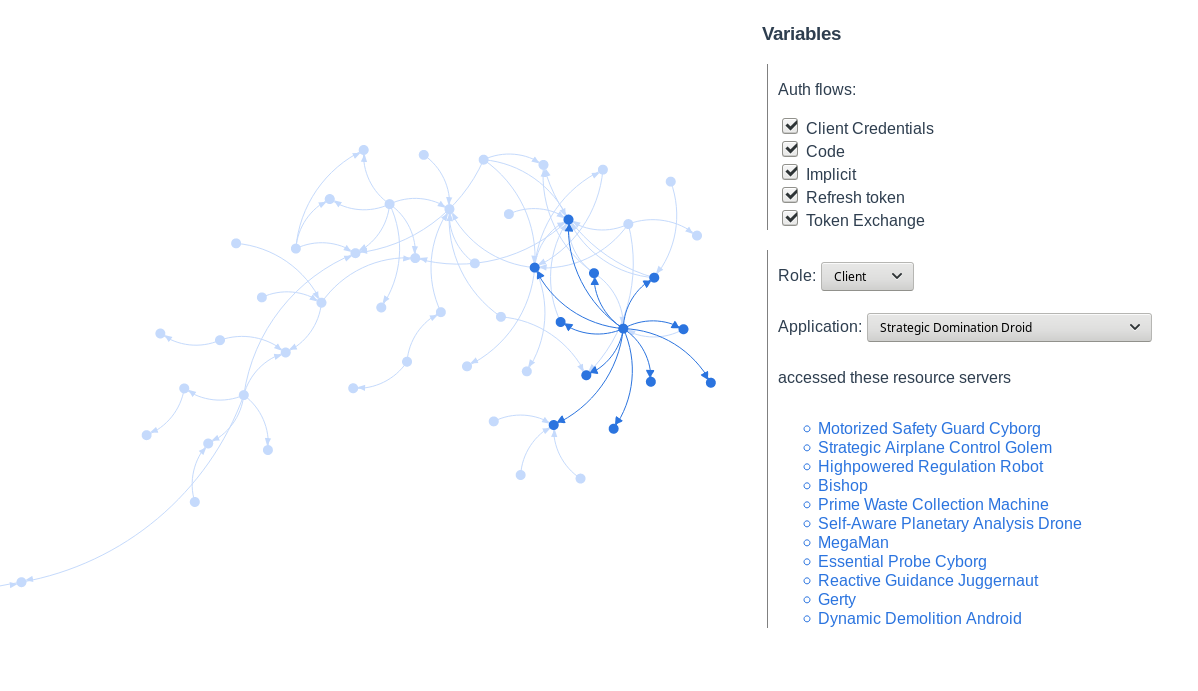
You might notice these are robot names; that's because I don't think it's reasonable to share my company's auth logs.
For this to work, you need to have access to logs of an authentication server that has implemented the Oauth2 and OIDC specifications. You also need to log each time a client requests a token to access a resource server, and which authentication flow that uses.
This datavisualisation does some interesting things, with some links to where I found the useful content:
- Highlights vertices and edges between vertices, from Robin Weiser's article
- Has rounded edges with arrows to indicate direction, from d3noob's block
- Has collision detection, meaning that vertices don't appear to sit on top of each other, from Mike Bostock's block
- Allows dragging the dataviz background, but I can't remember where I found that.