Reporting on surveys — are you doing it right?
Surveys are a constant part of the news cycle. They promise us a snapshot of our nation. As journalists, we rely on them — and the statistics we use can change opinions and drive policymaking. Yet news stories about even the highest quality surveys can lack context and mislead the public. Here, statisticians and survey experts give us their top tips on sussing out surveys and using them wisely.
Context is king
Journalists who are tentative about numbers sometimes take surveys at face value as authoritative. But they’re sources like any others. And all surveys have limitations. It’s important for reporters to read the methods and fine print.
Most surveys do not try to ask questions of everyone; rather, they select a sample population.
A good sample represents the entire population as closely as possible by carefully targeting people of certain demographics. Other surveys are more haphazard, with no attempts to select a representative sample.
The worst surveys ask biased questions and do not include details about collection methods or limitations. Online surveys, for instance, may allow users to participate more than once by deleting their browser cookies.
But online surveys are fraught in other ways.
Professor Andrew Markus is behind the Scanlon Foundation’s annual Mapping Social Cohesion survey — the largest of its kind in Australia.
He said reporters should look at whether a survey used a probability sample or a non-probability one.
Probability sampling is a technique that selects people randomly, so that every person in the population has an equal chance of being selected. With non-probability sampling, the surveyors are choosing who to sample non-randomly.
Online polls can be useful, but “the issue is to determine what has been done by the people running the survey to establish the reliability of the sample,” Professor Markus said.
The nonprofit Pew Research Centre concurs online surveys can be legitimate, if they select and ask people to participate before asking them to complete the survey online.
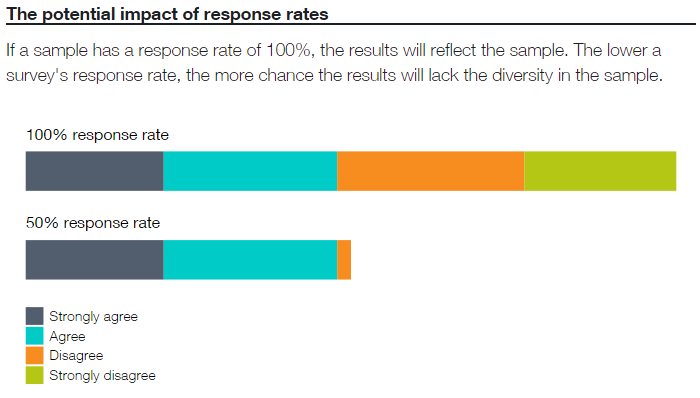
Even if a survey sample does closely represent a population, bias may still creep into the results, Professor David Steel said. Steel is the director of National Institute for Applied Statistics Research Australia.
He recommended keeping an eye on surveys’ response rates. The people who do respond might be different from those who do not.
A broad indicator of a survey’s reliability is its sample size. Generally, a larger sample will better-represent a population and the results will be more certain. But there is more to it than just that, Professor Steel said.
“Exactly how the sample was obtained is also key,” he said. “What geographic areas were included? Were remote and rural areas included?”
Looking at the big picture is important, too.
Professor Markus said reporters frequently fail to cite past results and methods.
“The most common mistake is to not provide context,” Professor Markus said.
And an important piece of context is who conducted or paid for the survey and why.
“Are they conducting the survey to support a political campaign that they are running?” Professor Markus said.
When possible, read the survey questions. They can reveal the motivations of those who conduct surveys are sometimes revealed, Steel said. Look at what questions are asked. Look for leading questions and language designed to elicit emotions. Look for questions that assume the participants have certain knowledge.
The answers to these questions and other important considerations will often not be published with the survey data. So digging up biases may require asking the surveyors some questions.
The nation's most misunderstood survey
Some surveys are solid but reporters misuse them.
It’s easy when you’re on a deadline to look at the headline figures for monthly unemployment data and report them as is. But David Kalisch, the head statistician at the Australian Bureau of Statistics, urged reporters to read past the headline — and get a better sense of what the monthly change in unemployment really represents.
That statistic refers to a net change — people entering minus those leaving unemployment — and cannot tell us about people who have moved jobs or worked more than one job. People lose the label “unemployed” by getting a job — or by leaving the workforce entirely, as retirees.
And many journalists forget that ABS monthly unemployment figures are estimates based on a survey.
“With any sample survey, where you collect information from a sample of people and not the entire population, there is a statistical uncertainty,” Mr Kalisch said.
The trend is your friend
That uncertainty has consequences for reporters. First, it means you can’t easily draw conclusions from monthly changes on their own.
Instead, look at the overall trends.
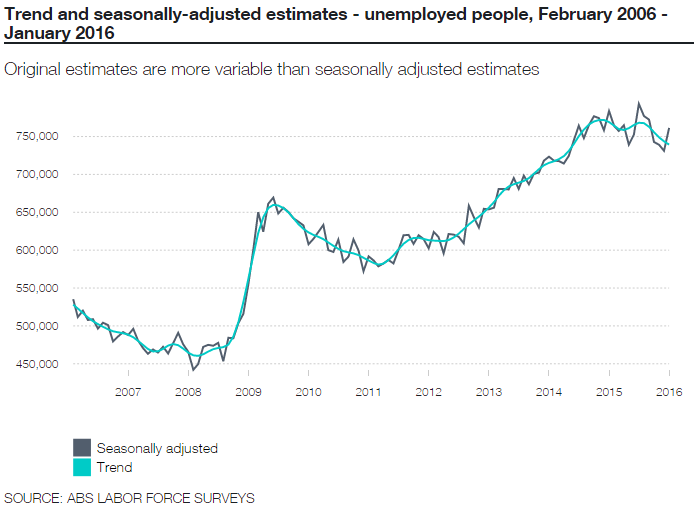
For each month, the ABS publishes several types of unemployment estimates: original, seasonally adjusted and trend data.
Seasonally adjusted estimates take into account influences like holidays and the effects of weather, but are still subject to short-term fluctuations, often due to real-world events.
Trend data has most noise removed and is the best indicator of how estimates have changed.
Be wary of the errors
All surveys that rely on samples should include standard errors, and the ABS unemployment data is no exception.
The monthly Labour Force Survey data is published with tables of standard errors for level estimates (each month) and movement estimates (changes between months). Details about the standard errors are under the “Explanatory Notes” and then “Standard Error” tabs on the ABS website for every monthly Labour Force Survey release.
These errors help us understand what the real unemployment numbers may be across Australia.
Here’s an example of how it works. For the seasonally adjusted movement estimate of 30,200 unemployed Australians aged 15 years or older (761,400 in January minus 731,200 in December 2015), there was a standard error of 19,900. That means we can be 66 per cent certain the real movement was between 10,300 and 50,100 (plus or minus 19,900).
If we double the standard error (19,900 to 38,900) then the ABS says it’s even more certain (95 per cent sure) the real estimate is between -9,600 and 70,000 (plus or minus the standard error).
With these estimates of certainty, we can get an idea of how unhelpful concentrating on the monthly change in seasonally adjusted figures can be.
Together, the trend of survey results and the standard error can tell us and readers about the direction and certainty of a monthly change. So when you write your story, report the error along with the estimates.
Political opinion polls also have standard errors, but won’t always provide those details up front (you may have to ask the pollsters).
In an opinion poll provided to SBS News this election campaign, the pollsters said they were 95 per cent sure the results were within three per cent of Australia’s population.
What does this mean? It means a small difference — say 51 per cent vs 49 per cent on an issue — might be due to a sampling error.
For questions that have a wider gap, like 65 per cent vs 35 per cent, we can be more certain the difference does not come down to errors alone.
Surveys are sources, like experts or pundits, and it’s wise to check their credentials before you give them oxygen.